 Here are a few more *statistics that I think you will find interesting:
-
3,000 were single family homes
-
1,800 single family homes were listed under $300,000.
-
586 of the 3,000 were 'short sales'., of which 78% were listings under $300,000.
-
Of the 3,000 single family home closed sales year-to-date, only 17 were short sales listed at or above $1 million
-
709 of the 3,000 were foreclosed homes, of which 89% were listed under $300,000.
-
3,495 were condos/villas
-
2,505 condos/villas were listed under $300,000.
-
506 of the 3,495 were short sales, of which 94% were listed under $300,000.
-
552 of the 3,495 were foreclosed condos/villas, of which 96% were listed under $300,000.
-
There was a total of 237 closed condos/villas year-to-date listed at or above $1 million. Only 1 of the 237 closings was a short sale.
-
There haven't been any condos/villas closed year-to-date, listed at or above $1 million that were categorized as foreclosed properties.
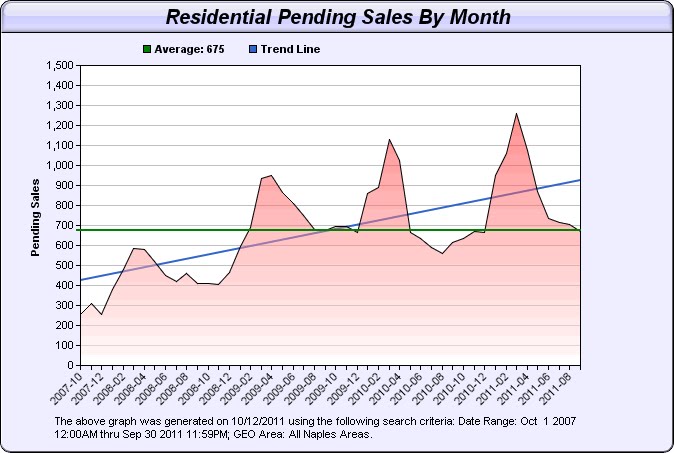
A few more stats: Current inventory in Naples, residential listings, is down 18.5% over this same time period last year. With pendings up 11% and inventory down to approximately a 9 month supply, I believe we are beginning to see a seller's market again in some choice neighborhoods. The absorption rate varies from community to community, and I would be happy to do a more specific analysis for you. The lower priced listings are still driving the market, but there is no question we are seeing a dramatic rebound in the Naples luxury market. Also, the lack of inventory in new and newer homes due to the slow down in construction has created opportunities for sellers in neighborhoods built since 2000. We are even seeing multiple offers in some cases when homes and condos are priced fairly. There are also some fabulous values to be found in the "tear down" market in the neighborhoods along the beach and waterfront. Royal Harbor as an example, which had approximately a 9 1/2 year absorption rate just a few short years ago, now has less than a one year supply. Old Naples presently has 63 Active single family homes listed, whereas there have been 55 closings year to date...another example of less than a year's supply of inventory.
For additional details about The Naples Real Estate market, please call a member of The Harris Peppe Team today. We look forward to hearing from you soon and hope to earn your business. 239.370.0574
Thank you and make it a great day,
The Naples Real Estate Blogger
*The source of this information is compiled from data obtained from SunshineMLS. The accuracy is not warranted or guaranteed and should be independently verified if one intends to engage in a transaction based upon it.
Subaru Forester Turbocharger
ReplyDeleteThanks for honestly relating your experiences and opinions and good luck to you.